Gray 大佬已排查到关键之处:
As I mentioned, kernel forbids background processes to call tcsetattr(TCSADRAIN), so the following syscall for sure failed:
1
|
20:18:26 ioctl(3, TCGETS, ...}) = -1 EIO (Input/output error) <0.000007>
|
但但但是,我确实不知道内核会有如此行为,也不知道内核为什么要这样做。
那么,问题就变成:ioctl 系统调用为什么返回了 -EIO 呢?
将问题泛化一下,就是 Gray 大佬困惑多年的难题:如何排查系统调用返回错误的原因?
以这次 ioctl 系统调用返回 -EIO 为例,使用 bpfsnoop 排查其原因。
English version: python/cpython#ssues/135329#issuecomment-3235826338.
0. 实验环境信息
 1
 2
 3
 4
 5
 6
 7
 8
 9
10
11
12
13
14
15
|
$ lsb_release -a
Distributor ID: Ubuntu
Description:    Ubuntu 24.04.1 LTS
Release:    24.04
Codename:   noble

$ uname -a
Linux HOSTNAME 6.6.0-47.XXX #47~24.04 SMP Fri Dec 20 16:05:43 +08 2024 x86_64 x86_64 x86_64 GNU/Linux

$ dmesg | grep -i lbr
[   13.116840] Performance Events: PEBS fmt3+, Skylake events, 32-deep LBR, full-width counters, Intel PMU driver.

$ apt info linux-image-$(uname -r)-dbgsym
Package: linux-image-6.6.0-47.XXX-dbgsym
Version: 6.6.0-47.XXX~24.04
|
其中:
- LBR: Intel CPU 提供的 Last Branch Record 功能,用于记录最近的分支信息。
- dbgsym: 内核调试符号包,用于
bpfsnoop 获取内核函数的源码行号信息。
- 内核版本: v5.17+ 才能支持
bpf_get_branch_snapshot() helper。
1. 确认系统调用结果
已知有问题的 Python 进程 PID 为 289473。
确认内核态 ioctl 系统调用的返回值:

-5 就是 -EIO:
1
2
|
$ errno -l
EIO 5 Input/output error
|
2. 获取 __x64_sys_ioctl 的 funcgraph
并不清楚 __x64_sys_ioctl 会调用哪些函数。
而 ftrace 的 function_graph tracer 可以帮助我们获取函数调用的图谱信息。
然而,更偏爱 bpfsnoop 的 funcgraph 功能:

非常不幸,得到的 funcgraph 信息并没什么用处。这是因为 bpfsnoop funcgraph 功能无法跟踪间接调用的函数。
该如何突破这个限制呢?
3. 获取 __x64_sys_ioctl 的 LBR
Intel CPU 的 LBR 功能正是为此而存在:
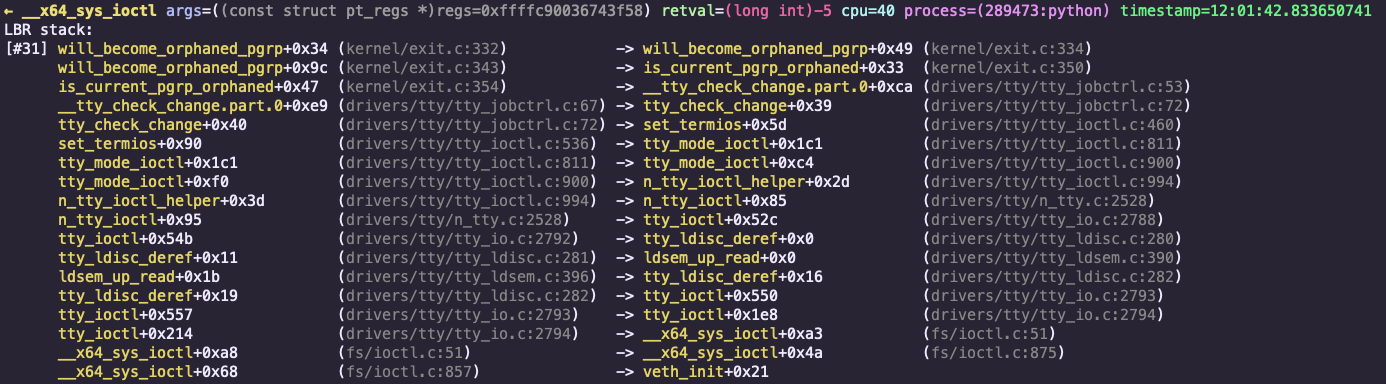
完美!
从中可以看出:tty_ioctl 正是藏在 __x64_sys_ioctl 背后的函数。
4. 获取 tty_ioctl 的 funcgraph
那么,具体是哪个函数返回了 -5 呢?
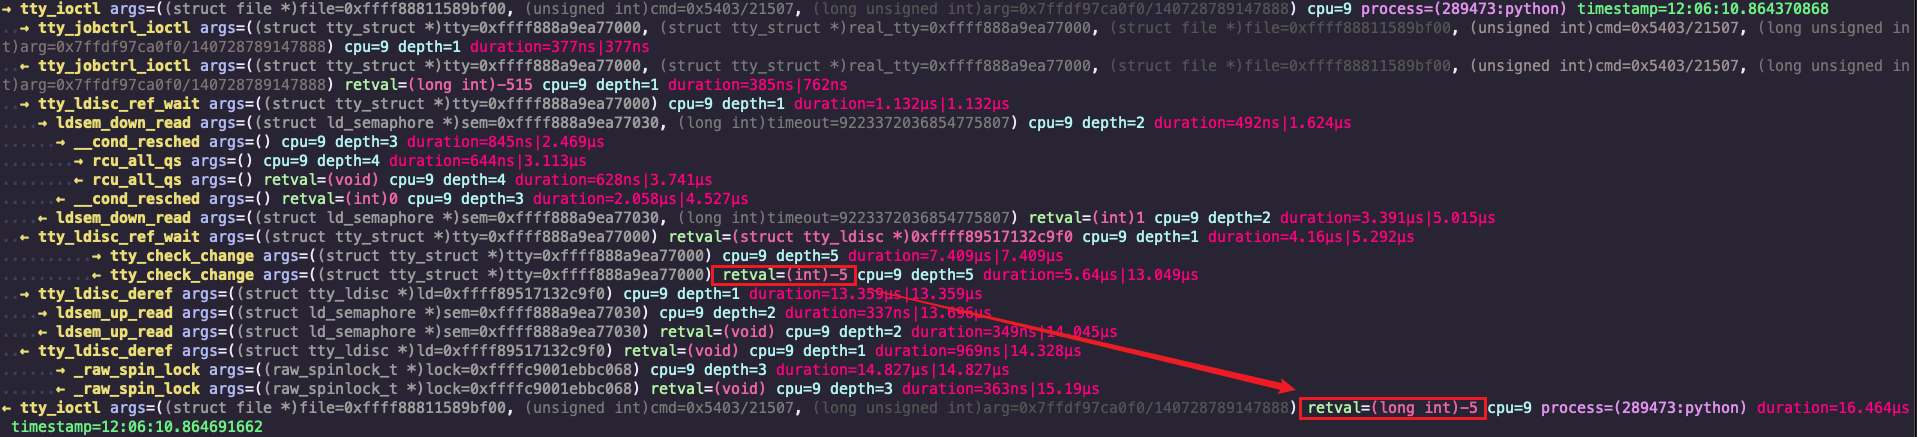
关注每个函数的返回值,找到返回 -5 的那个:正是 tty_check_change。
5. 获取 tty_check_change 的 funcgraph 和 LBR
1
2
3
|
$ sudo ./bpfsnoop -k 'tty_check_change' --output-fgraph --filter-pid 289473 --limit-events 10
→ tty_check_change args=((struct tty_struct *)tty=0xffff888a9ea77000) cpu=20 process=(289473:python) timestamp=12:10:00.98960753
← tty_check_change args=((struct tty_struct *)tty=0xffff888a9ea77000) retval=(int)-5 cpu=20 process=(289473:python) duration=3.294µs timestamp=12:10:00.989620588
|
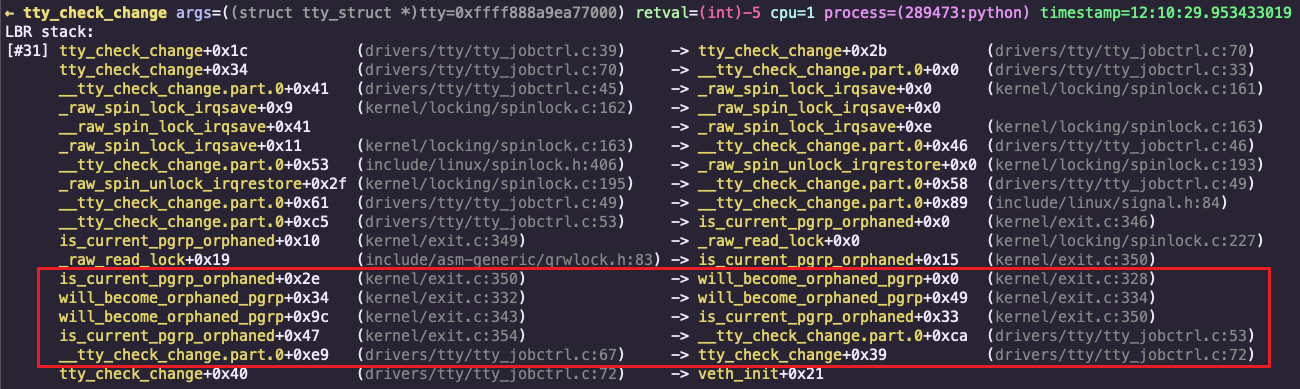
关注圈出来的那几条记录。
先看下 tty_check_change 的源代码 tty_jobctrl.c:
 1
 2
 3
 4
 5
 6
 7
 8
 9
10
11
12
13
14
15
16
17
18
19
20
21
22
23
24
25
26
27
28
29
30
31
32
33
34
35
36
37
38
39
40
|
  33   │ int __tty_check_change(struct tty_struct *tty, int sig)
  34   │ {
  35   │         unsigned long flags;
  36   │         struct pid *pgrp, *tty_pgrp;
  37   │         int ret = 0;
  38   │
  39   │         if (current->signal->tty != tty)
  40   │                 return 0;
  41   │
  42   │         rcu_read_lock();
  43   │         pgrp = task_pgrp(current);
  44   │
  45   │         spin_lock_irqsave(&tty->ctrl.lock, flags);
  46   │         tty_pgrp = tty->ctrl.pgrp;
  47   │         spin_unlock_irqrestore(&tty->ctrl.lock, flags);
  48   │
  49   │         if (tty_pgrp && pgrp != tty_pgrp) {
  50   │                 if (is_ignored(sig)) {
  51   │                         if (sig == SIGTTIN)
  52   │                                 ret = -EIO;
  53   │                 } else if (is_current_pgrp_orphaned())
  54   │                         ret = -EIO;
  55   │                 else {
  56   │                         kill_pgrp(pgrp, sig, 1);
  57   │                         set_thread_flag(TIF_SIGPENDING);
  58   │                         ret = -ERESTARTSYS;
  59   │                 }
  60   │         }
  61   │         rcu_read_unlock();
  62   │
  63   │         if (!tty_pgrp)
  64   │                 tty_warn(tty, "sig=%d, tty->pgrp == NULL!\n", sig);
  65   │
  66   │         return ret;
  67   │ }
  68   │
  69   │ int tty_check_change(struct tty_struct *tty)
  70   │ {
  71   │         return __tty_check_change(tty, SIGTTOU);
  72   │ }
|
LBR 记录直接明了地告知了 -EIO 的出处。
6. is_current_pgrp_orphaned
看下 is_current_pgrp_orphaned 的源代码 exit.c:
 1
 2
 3
 4
 5
 6
 7
 8
 9
10
11
12
13
14
15
16
17
18
19
20
21
22
23
24
25
26
27
28
29
30
31
32
33
34
35
36
37
|
 318   │ /*
 319   │  * Determine if a process group is "orphaned", according to the POSIX
 320   │  * definition in 2.2.2.52.  Orphaned process groups are not to be affected
 321   │  * by terminal-generated stop signals.  Newly orphaned process groups are
 322   │  * to receive a SIGHUP and a SIGCONT.
 323   │  *
 324   │  * "I ask you, have you ever known what it is to be an orphan?"
 325   │  */
 326   │ static int will_become_orphaned_pgrp(struct pid *pgrp,
 327   │                                      struct task_struct *ignored_task)
 328   │ {
 329   │         struct task_struct *p;
 330   │
 331   │         do_each_pid_task(pgrp, PIDTYPE_PGID, p) {
 332   │                 if ((p == ignored_task) ||
 333   │                     (p->exit_state && thread_group_empty(p)) ||
 334   │                     is_global_init(p->real_parent))
 335   │                         continue;
 336   │
 337   │                 if (task_pgrp(p->real_parent) != pgrp &&
 338   │                     task_session(p->real_parent) == task_session(p))
 339   │                         return 0;
 340   │         } while_each_pid_task(pgrp, PIDTYPE_PGID, p);
 341   │
 342   │         return 1;
 343   │ }
 344   │
 345   │ int is_current_pgrp_orphaned(void)
 346   │ {
 347   │         int retval;
 348   │
 349   │         read_lock(&tasklist_lock);
 350   │         retval = will_become_orphaned_pgrp(task_pgrp(current), NULL);
 351   │         read_unlock(&tasklist_lock);
 352   │
 353   │         return retval;
 354   │ }
|
惊喜发现:will_become_orphaned_pgrp 的注释解释了内核对待孤儿进程组的策略。
7. 结论
ioctl 系统调用返回 -EIO 的原因是:当前进程的父进程组是孤儿进程组。
小结
对系统调用返回错误的情况,可以使用 bpfsnoop 进行排查:
- funcgraph 功能 (
--output-fgraph): 可以便捷地了解到目标函数会调用哪些函数。
- LBR 功能 (
--output-lbr): 借助于 CPU 提供的 LBR 能力,突破 funcgraph 功能缺陷,能够追踪到代码逻辑分支记录。
- funcstack 功能 (
--output-stack): 可以获取到目标函数的函数调用栈记录,帮助分析函数调用关系。
- funcinsn 功能 (
--output-insns): 可以获取到目标函数的指令级别的执行记录,帮助分析目标函数具体的执行过程。