既然可以对 bpf2bpf 函数调用进行 trace,是否可以对 freplace 程序进行 trace 呢?

先复习一下 freplace 的原理:

trace freplace 程序的 demo

demo 效果如下:

 1
 2
 3
 4
 5
 6
 7
 8
 9
10
11
# ./fentry_fexit-freplace
2023/07/16 23:28:43 Attached fentry(freplace)
2023/07/16 23:28:43 Attached fexit(freplace)
2023/07/16 23:28:43 Attached freplace on k_tcp_connect
2023/07/16 23:28:43 Attached freplace on k_icsk_complete_hashdance
2023/07/16 23:28:43 Attached kprobe(tcp_connect)
2023/07/16 23:28:43 Attached kprobe(inet_csk_complete_hashdance)
2023/07/16 23:28:43 Listening events...
2023/07/16 23:28:46 new tcp connection: 10.0.2.15:58906 -> 142.251.10.113:80 (kprobe)
2023/07/16 23:28:46 new tcp connection: 10.0.2.15:58906 -> 142.251.10.113:80 (fentry)
2023/07/16 23:28:46 new tcp connection: 10.0.2.15:58906 -> 142.251.10.113:80 (fexit: 0)

其中使用的 trace 手段是 fentryfexit

demo 使用的 bpf 代码如下:

 1
 2
 3
 4
 5
 6
 7
 8
 9
10
11
12
13
14
15
16
17
18
19
20
21
22
23
24
25
26
27
28
29
30
31
32
33
34
35
36
37
38
39
40
41
42
struct sock_args {
    struct sock *sk;
};

struct {
    __uint(type, BPF_MAP_TYPE_PERCPU_ARRAY);
    __type(key, __u32);
    __type(value, struct sock_args);
    __uint(max_entries, 1);
} socks SEC(".maps");

SEC("fentry/freplace_handler")
int BPF_PROG(fentry_freplace_handler)
{
    bpf_printk("fentry, freplace handler\n");

    __u32 key = 0;
    struct sock_args *args = bpf_map_lookup_elem(&socks, &key);
    if (!args)
        return 0;

    struct sock *sk = args->sk;
    __handle_new_connection(ctx, sk, PROBE_TYPE_FENTRY, 0);

    return 0;
}

SEC("fexit/freplace_handler")
int BPF_PROG(fexit_freplace_handler, int retval)
{
    bpf_printk("fexit, freplace handler\n");

    __u32 key = 0;
    struct sock_args *args = bpf_map_lookup_and_delete(&socks, &key);
    if (!args)
        return 0;

    struct sock *sk = args->sk;
    __handle_new_connection(ctx, sk, PROBE_TYPE_FEXIT, retval);

    return 0;
}

freplace 的 bpf 代码如下:

1
2
3
4
5
6
7
SEC("freplace/stub_handler")
int freplace_handler()
{
    bpf_printk("freplace, replaced handler\n");

    return 0;
}

kprobe 的 bpf 代码如下:

 1
 2
 3
 4
 5
 6
 7
 8
 9
10
11
12
13
14
15
16
17
18
19
20
21
22
23
24
25
26
27
28
29
30
31
32
33
34
35
36
37
38
39
40
41
42
43
44
45
46
47
48
49
50
51
52
53
54
struct sock_args {
    struct sock *sk;
};

struct {
    __uint(type, BPF_MAP_TYPE_PERCPU_ARRAY);
    __type(key, __u32);
    __type(value, struct sock_args);
    __uint(max_entries, 1);
} socks SEC(".maps");

__noinline int
stub_handler()
{
    bpf_printk("freplace, stub handler\n");

    return 0;
}

SEC("kprobe/tcp_connect")
int k_tcp_connect(struct pt_regs *ctx)
{
    struct sock *sk;
    sk = (typeof(sk))PT_REGS_PARM1(ctx);

    struct sock_args args = {
        .sk = sk,
    };

    __u32 key = 0;
    bpf_map_update_elem(&socks, &key, &args, BPF_ANY);

    __handle_new_connection(ctx, sk, PROBE_TYPE_DEFAULT, 0);

    return stub_handler();
}

SEC("kprobe/inet_csk_complete_hashdance")
int k_icsk_complete_hashdance(struct pt_regs *ctx)
{
    struct sock *sk;
    sk = (typeof(sk))PT_REGS_PARM2(ctx);

    struct sock_args args = {
        .sk = sk,
    };

    __u32 key = 0;
    bpf_map_update_elem(&socks, &key, &args, BPF_ANY);

    __handle_new_connection(ctx, sk, PROBE_TYPE_DEFAULT, 0);

    return stub_handler();
}

P.S. 为了将 demo 跑起来,stub_handler() 打桩函数并没有传递参数(否则会出错,根因未知);而是通过一个 BPF_MAP_TYPE_PERCPU_ARRAY bpf map 来传递 struct sock *sk

P.S. 已补充 XDP demo 的代码;基于 XDP 的 demo 没有如上问题。

demo 源代码:

trace freplace 程序的本质

其实跟 trace bpf2bpf 函数调用一样,只不过场景更复杂一些。

以下分析一下 trace freplace 程序后的 x86 汇编指令:

 1
 2
 3
 4
 5
 6
 7
 8
 9
10
11
12
13
14
15
16
17
18
19
20
21
22
23
24
25
26
27
28
29
30
31
32
33
34
35
36
37
38
39
40
41
42
43
44
45
46
47
48
49
50
51
52
53
54
55
56
57
58
59
60
61
62
63
64
65
66
67
68
69
70
71
72
73
74
75
76
77
# tail /proc/kallsyms
ffffffffc02e90c8 t bpf_prog_195beb253db03fbe_k_icsk_complete_hashdance  [bpf]
ffffffffc02e920c t bpf_prog_0456a7fc6de84cc2_stub_handler       [bpf]
ffffffffc02e90c8 t bpf_prog_dca023555bb1a6fc_k_icsk_complete_hashdance  [bpf]
ffffffffc02e9258 t bpf_prog_77b652bc40a8cde7_k_tcp_connect      [bpf]
ffffffffc02e9398 t bpf_prog_0456a7fc6de84cc2_stub_handler       [bpf]
ffffffffc02e9258 t bpf_prog_b1872b28057f711b_k_tcp_connect      [bpf]
ffffffffc02e93c8 t bpf_prog_c293f5345a8a5f0e_freplace_handler   [bpf]
ffffffffc02e9414 t bpf_prog_eef12c319a7cffba_fentry_freplace_handler    [bpf]
ffffffffc02e9554 t bpf_prog_304017504bb64be8_fexit_freplace_handler     [bpf]
ffffffffc05b0000 t bpf_trampoline_618475290625_1        [bpf]

# gdb -q -c /proc/kcore -ex 'x/150i 0xffffffffc02e9258' -ex 'quit'
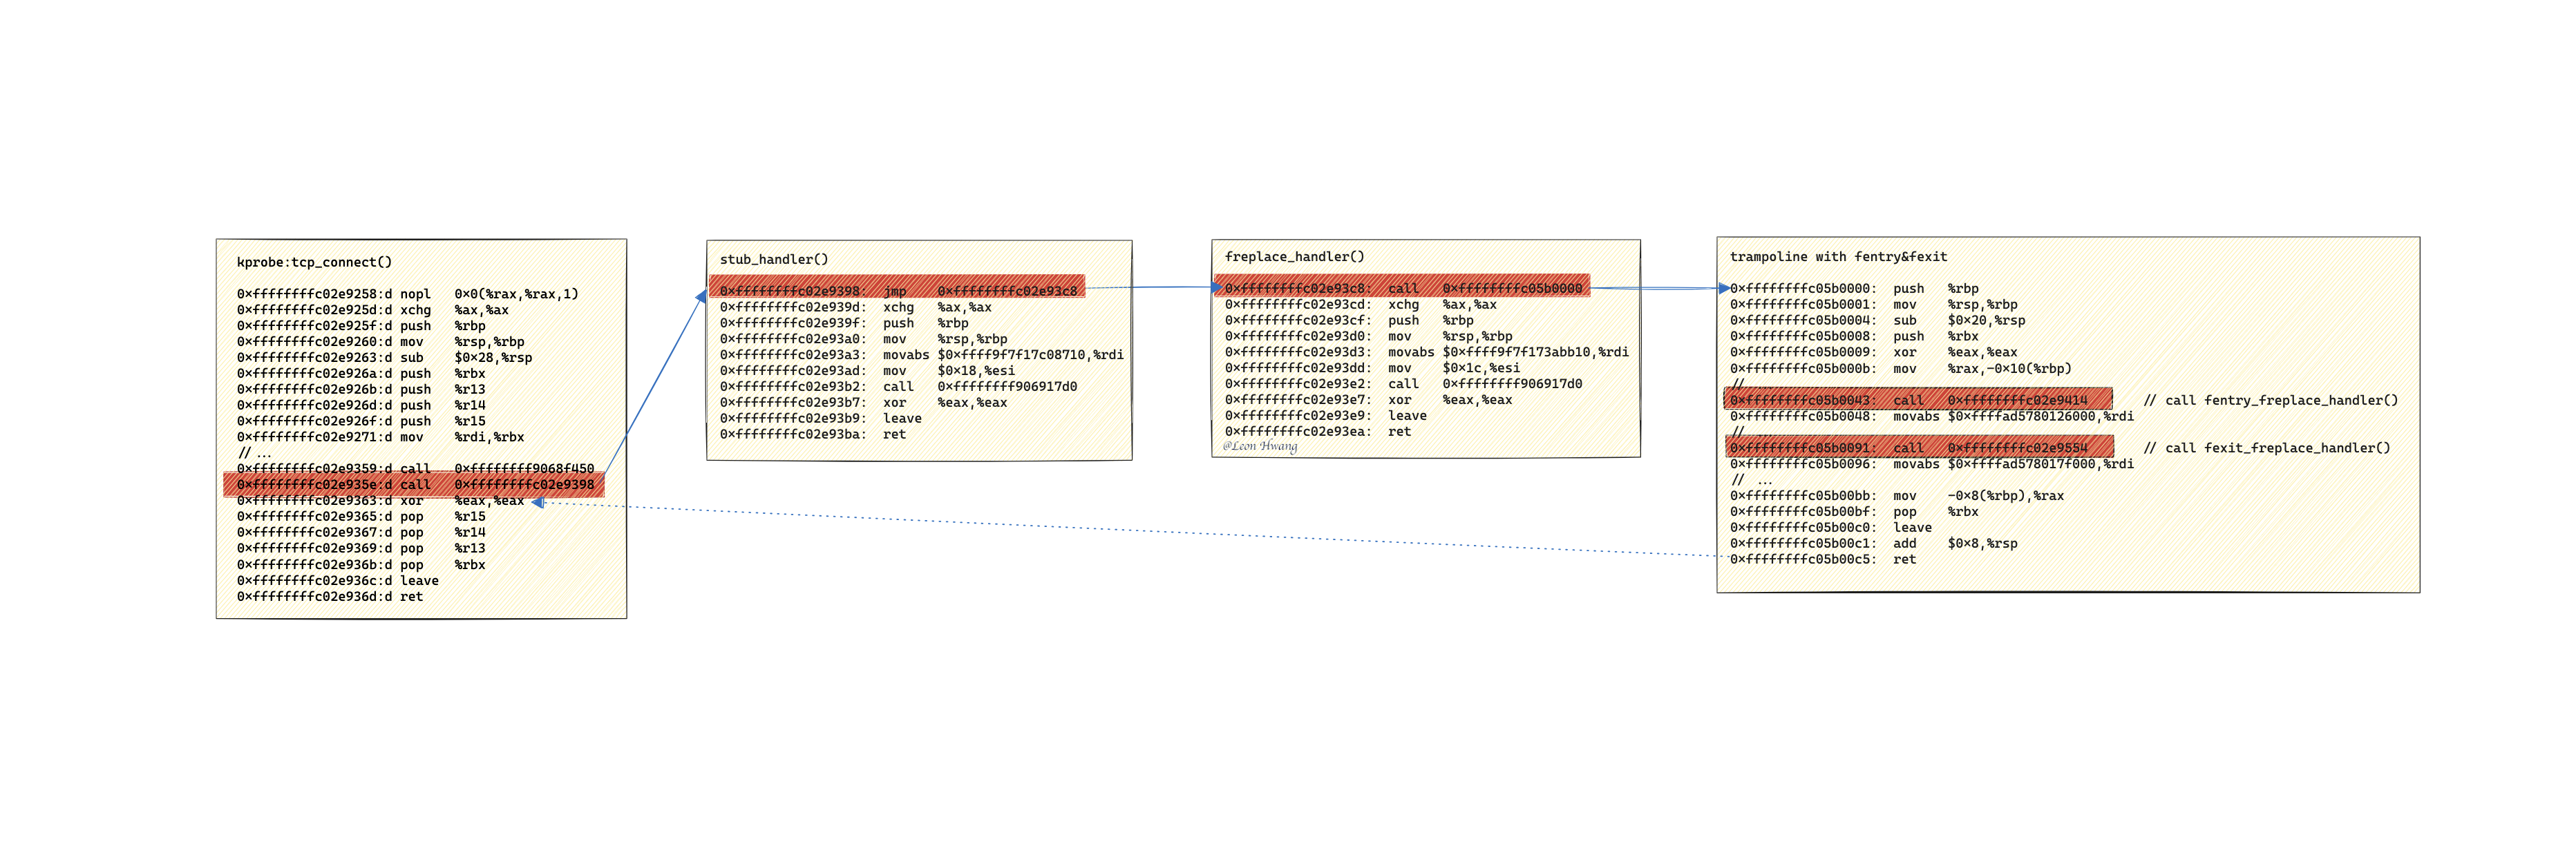
   0xffffffffc02e9258:d nopl   0x0(%rax,%rax,1)
   0xffffffffc02e925d:d xchg   %ax,%ax
   0xffffffffc02e925f:d push   %rbp
   0xffffffffc02e9260:d mov    %rsp,%rbp
   0xffffffffc02e9263:d sub    $0x28,%rsp
   0xffffffffc02e926a:d push   %rbx
   0xffffffffc02e926b:d push   %r13
   0xffffffffc02e926d:d push   %r14
   0xffffffffc02e926f:d push   %r15
   0xffffffffc02e9271:d mov    %rdi,%rbx
   //...
   0xffffffffc02e9359:d call   0xffffffff9068f450
   0xffffffffc02e935e:d call   0xffffffffc02e9398   // call stub_handler()
   0xffffffffc02e9363:d xor    %eax,%eax
   0xffffffffc02e9365:d pop    %r15
   0xffffffffc02e9367:d pop    %r14
   0xffffffffc02e9369:d pop    %r13
   0xffffffffc02e936b:d pop    %rbx
   0xffffffffc02e936c:d leave
   0xffffffffc02e936d:d ret

# gdb -q -c /proc/kcore -ex 'x/150i 0xffffffffc02e9398' -ex 'quit'
   0xffffffffc02e9398:  jmp    0xffffffffc02e93c8   // jump to freplace_handler()
   0xffffffffc02e939d:  xchg   %ax,%ax
   0xffffffffc02e939f:  push   %rbp
   0xffffffffc02e93a0:  mov    %rsp,%rbp
   0xffffffffc02e93a3:  movabs $0xffff9f7f17c08710,%rdi
   0xffffffffc02e93ad:  mov    $0x18,%esi
   0xffffffffc02e93b2:  call   0xffffffff906917d0
   0xffffffffc02e93b7:  xor    %eax,%eax
   0xffffffffc02e93b9:  leave
   0xffffffffc02e93ba:  ret

# gdb -q -c /proc/kcore -ex 'x/150i 0xffffffffc02e93c8' -ex 'quit'
   0xffffffffc02e93c8:  call   0xffffffffc05b0000   // call bpf_trampoline_618475290625_1
   0xffffffffc02e93cd:  xchg   %ax,%ax
   0xffffffffc02e93cf:  push   %rbp
   0xffffffffc02e93d0:  mov    %rsp,%rbp
   0xffffffffc02e93d3:  movabs $0xffff9f7f173abb10,%rdi
   0xffffffffc02e93dd:  mov    $0x1c,%esi
   0xffffffffc02e93e2:  call   0xffffffff906917d0
   0xffffffffc02e93e7:  xor    %eax,%eax
   0xffffffffc02e93e9:  leave
   0xffffffffc02e93ea:  ret

# gdb -q -c /proc/kcore -ex 'x/150i 0xffffffffc05b0000' -ex 'quit'
   0xffffffffc05b0000:  push   %rbp
   0xffffffffc05b0001:  mov    %rsp,%rbp
   0xffffffffc05b0004:  sub    $0x20,%rsp
   0xffffffffc05b0008:  push   %rbx
   0xffffffffc05b0009:  xor    %eax,%eax
   0xffffffffc05b000b:  mov    %rax,-0x10(%rbp)
   // ...
   0xffffffffc05b0043:  call   0xffffffffc02e9414       // call fentry_freplace_handler()
   0xffffffffc05b0048:  movabs $0xffffad5780126000,%rdi
   // ...
   0xffffffffc05b0091:  call   0xffffffffc02e9554       // call fexit_freplace_handler()
   0xffffffffc05b0096:  movabs $0xffffad578017f000,%rdi
   // ...
   0xffffffffc05b00bb:  mov    -0x8(%rbp),%rax
   0xffffffffc05b00bf:  pop    %rbx
   0xffffffffc05b00c0:  leave
   0xffffffffc05b00c1:  add    $0x8,%rsp
   0xffffffffc05b00c5:  ret

trace freplace

通过 x86 汇编指令可以看到,从 kprobe 到 stub handler 到 freplace handler 最后到 fentry/fexit handler 的完整执行流程。

  1. kprobe 到 stub handler 是 call 指令。
  2. stub handler 到 freplace handler 是 jmp 指令。
  3. freplace handler 到 fentry/fexit handler 是 call 指令。

小结

  • trace freplace 程序的本质也是对 bpf 纯函数的 trace。

通过分析 x86 汇编指令,可以看到 trace freplace 程序的完整执行流程。