既然可以对 freplace 程序进行 trace,是否可以对 tailcall 程序进行 trace 呢?
TL;DR: NO!经过 demo 验证,发现是不行的。
trace tailcall 程序的 demo
demo 效果如下:
1
2
3
4
5
6
7
8
|
# ./fentry_fexit-tailcall
2023/07/19 21:44:34 Attached fentry(tailcall)
2023/07/19 21:44:34 Attached fexit(tailcall)
2023/07/19 21:44:34 Prepared tailcall(handle_new_connection)
2023/07/19 21:44:35 Attached kprobe(tcp_connect)
2023/07/19 21:44:35 Attached kprobe(inet_csk_complete_hashdance)
2023/07/19 21:44:35 Listening events...
2023/07/19 21:44:38 new tcp connection: 10.0.2.15:42990 -> 74.125.130.113:80 (kprobe)
|
其中使用的 trace 手段是 fentry 和 fexit。
demo 中使用的 fentry/fexit bpf 代码如下:
 1
 2
 3
 4
 5
 6
 7
 8
 9
10
11
12
13
14
15
16
17
18
19
20
21
22
23
24
25
26
27
28
29
30
31
32
33
34
35
36
37
38
|
struct {
    __uint(type, BPF_MAP_TYPE_PERCPU_ARRAY);
    __type(key, __u32);
    __type(value, __u64);
    __uint(max_entries, 1);
} socks SEC(".maps");

SEC("fentry/tailcall")
int BPF_PROG(fentry_tailcall, struct pt_regs *regs)
{
    bpf_printk("tcpconn, fentry_tailcall\n");

    __u32 key = 0;
    struct sock **skp = bpf_map_lookup_elem(&socks, &key);
    if (!skp)
        return 0;

    struct sock *sk = *skp;
    __handle_new_connection(ctx, sk, PROBE_TYPE_FENTRY, 0);

    return 0;
}

SEC("fexit/tailcall")
int BPF_PROG(fexit_tailcall, struct pt_regs *regs, int retval)
{
    bpf_printk("tcpconn, fexit_tailcall\n");

    __u32 key = 0;
    struct sock **skp = bpf_map_lookup_and_delete(&socks, &key);
    if (!skp)
        return 0;

    struct sock *sk = *skp;
    __handle_new_connection(ctx, sk, PROBE_TYPE_FEXIT, retval);

    return 0;
}
|
demo 中使用的 tailcall bpf 代码如下:
 1
 2
 3
 4
 5
 6
 7
 8
 9
10
11
12
13
14
15
16
17
18
19
20
21
22
23
24
25
26
27
28
29
30
31
32
33
34
35
36
37
38
39
40
41
42
43
44
45
46
47
48
49
50
51
52
53
54
55
56
57
58
|
struct {
    __uint(type, BPF_MAP_TYPE_PROG_ARRAY);
    __uint(key_size, 4);
    __uint(value_size, 4);
    __uint(max_entries, 1);
} progs SEC(".maps");

struct {
    __uint(type, BPF_MAP_TYPE_PERCPU_ARRAY);
    __type(key, __u32);
    __type(value, __u64);
    __uint(max_entries, 1);
} socks SEC(".maps");

SEC("kprobe/hanle_new_connection")
int handle_new_connection(struct pt_regs *ctx)
{
    __u32 key = 0;
    struct sock **skp = bpf_map_lookup_elem(&socks, &key);
    if (!skp)
        return 0;

    // bpf_map_delete_elem(&socks, &key);
    bpf_printk("tcpconn, handle_new_connection\n");

    struct sock *sk = *skp;
    __handle_new_connection(ctx, sk, PROBE_TYPE_DEFAULT, 0);

    return 0;
}

SEC("kprobe/tcp_connect")
int k_tcp_connect(struct pt_regs *ctx)
{
    struct sock *sk;
    sk = (typeof(sk))PT_REGS_PARM1(ctx);

    __u32 key = 0;
    bpf_map_update_elem(&socks, &key, &sk, BPF_ANY);

    bpf_tail_call_static(ctx, &progs, 0);

    return 0;
}

SEC("kprobe/inet_csk_complete_hashdance")
int k_icsk_complete_hashdance(struct pt_regs *ctx)
{
    struct sock *sk;
    sk = (typeof(sk))PT_REGS_PARM2(ctx);

    __u32 key = 0;
    bpf_map_update_elem(&socks, &key, &sk, BPF_ANY);

    bpf_tail_call_static(ctx, &progs, 0);

    return 0;
}
|
在 kprobe bpf 程序中通过 bpf_tail_call_static() 调用 tailcall bpf 程序 handle_new_connection()。
而后,对 handle_new_connection() 进行 fentry/fexit。
用户态的 Go 代码需要做的事情是:
 1
 2
 3
 4
 5
 6
 7
 8
 9
10
11
12
|
    spec, err := loadFentryFexit()
    if err != nil {
        log.Printf("Failed to load bpf obj: %v", err)
        return
    }

    tailcallFentry := spec.Programs["fentry_tailcall"]
    tailcallFentry.AttachTarget = obj.tcpconnPrograms.HandleNewConnection
    tailcallFentry.AttachTo = "handle_new_connection"
    tailcallFexit := spec.Programs["fexit_tailcall"]
    tailcallFexit.AttachTarget = obj.tcpconnPrograms.HandleNewConnection
    tailcallFexit.AttachTo = "handle_new_connection"
|
- 第一步,创建
kprobe 程序,其中包含了 tailcall 程序。
- 第二步,给
fentry 和 fexit 程序指定 AttachTarget 和 AttachTo。
- 其中,
AttachTarget 是 tailcall 程序,AttachTo 是 tailcall 程序中的函数名。
- 即,将
fentry 和 fexit 程序 attach 到 tailcall 程序的 handle_new_connection 函数上。
P.S. demo 源代码:GitHub Asphaltt/learn-by-example/ebpf/fentry_fexit-tailcall
fentry/fexit 的函数参数
仔细对比上面 fentry/fexit 的函数定义和 tailcall 程序的函数定义:
1
2
3
4
5
6
7
8
|
SEC("fentry/tailcall")
int BPF_PROG(fentry_tailcall, struct pt_regs *regs);

SEC("fexit/tailcall")
int BPF_PROG(fexit_tailcall, struct pt_regs *regs, int retval);

SEC("kprobe/hanle_new_connection")
int handle_new_connection(struct pt_regs *ctx);
|
bpf 中规定 tailcall 程序的函数参数必须是 ctx;所以,此处 tailcall 程序的函数参数是 struct pt_regs *regs。
tailcall 的更多详情,请参考:
理论上,使用 fentry/fexit 是能够对 tailcall 程序进行 trace 的。可是为什么就是不行呢?
下面从汇编的角度分析一下。
汇编分析
查看相关的函数入口地址:
1
2
3
4
5
6
7
|
# tail /proc/kallsyms
ffffffffc02e9114 t bpf_prog_62bef93723588309_handle_new_connection      [bpf]
ffffffffc02e926c t bpf_prog_3fb68e69f39b4dbf_k_icsk_complete_hashdance  [bpf]
ffffffffc02e9464 t bpf_prog_cd7cd930d5a4d05c_k_tcp_connect      [bpf]
ffffffffc02e9514 t bpf_prog_eef12c319a7cffba_fentry_tailcall    [bpf]
ffffffffc02e966c t bpf_prog_68da9df9fd9eec33_fexit_tailcall     [bpf]
ffffffffc05b0000 t bpf_trampoline_897648164865_1        [bpf]
|
kprobe tcp_connect() 的 x86 汇编指令如下:
 1
 2
 3
 4
 5
 6
 7
 8
 9
10
11
12
13
14
|
# gdb -q -c /proc/kcore -ex 'x/150i 0xffffffffc02e9464' -ex 'quit'
   0xffffffffc02e9464:  nopl   0x0(%rax,%rax,1)
   0xffffffffc02e9469:  xor    %eax,%eax
   0xffffffffc02e946b:  push   %rbp
   0xffffffffc02e946c:  mov    %rsp,%rbp
   0xffffffffc02e946f:  sub    $0x10,%rsp
   // ...
   0xffffffffc02e94df:  add    $0x10,%rsp
   0xffffffffc02e94e6:  jmp    0xffffffffc02e911f   // tailcall
   0xffffffffc02e94eb:  xor    %eax,%eax
   0xffffffffc02e94ed:  pop    %r13
   0xffffffffc02e94ef:  pop    %rbx
   0xffffffffc02e94f0:  leave
   0xffffffffc02e94f1:  ret
|
对 tailcall handle_new_connection() 函数进行 trace 后的 x86 汇编指令如下:
 1
 2
 3
 4
 5
 6
 7
 8
 9
10
11
12
13
14
15
16
17
18
|
# gdb -q -c /proc/kcore -ex 'x/150i 0xffffffffc02e9114' -ex 'quit'
   0xffffffffc02e9114:  call   0xffffffffc05b0000
   0xffffffffc02e9119:  xchg   %ax,%ax
   0xffffffffc02e911b:  push   %rbp
   0xffffffffc02e911c:  mov    %rsp,%rbp
   0xffffffffc02e911f:  sub    $0x18,%rsp
   0xffffffffc02e9126:  push   %rbx
   0xffffffffc02e9127:  push   %r13
   0xffffffffc02e9129:  push   %r14
   0xffffffffc02e912b:  push   %r15
   // ...
   0xffffffffc02e922d:  xor    %eax,%eax
   0xffffffffc02e922f:  pop    %r15
   0xffffffffc02e9231:  pop    %r14
   0xffffffffc02e9233:  pop    %r13
   0xffffffffc02e9235:  pop    %rbx
   0xffffffffc02e9236:  leave
   0xffffffffc02e9237:  ret
|
可以看到,第一条 nop 指令已被替换成 call 指令;而 call 指令的目标地址是 0xffffffffc05b0000,即 bpf_trampoline_897648164865_1,这是一个 bpf trampoline,里面会依次调用 fentry/fexit bpf 程序。
 1
 2
 3
 4
 5
 6
 7
 8
 9
10
11
12
13
14
15
16
|
# gdb -q -c /proc/kcore -ex 'x/150i 0xffffffffc05b0000' -ex 'quit'
   0xffffffffc05b0000:  push   %rbp
   0xffffffffc05b0001:  mov    %rsp,%rbp
   0xffffffffc05b0004:  sub    $0x48,%rsp
   0xffffffffc05b0008:  push   %rbx
   // ...
   0xffffffffc05b005a:  call   0xffffffffc02e9514       // fentry tailcall
   0xffffffffc05b005f:  movabs $0xffffad57800e5000,%rdi
   // ...
   0xffffffffc05b00bc:  call   0xffffffffc02e966c       // fexit tailcall
   0xffffffffc05b00c1:  movabs $0xffffad5780101000,%rdi
   // ...
   0xffffffffc05b00ea:  pop    %rbx
   0xffffffffc05b00eb:  leave
   0xffffffffc05b00ec:  add    $0x8,%rsp
   0xffffffffc05b00f0:  ret
|
画图分析一下:
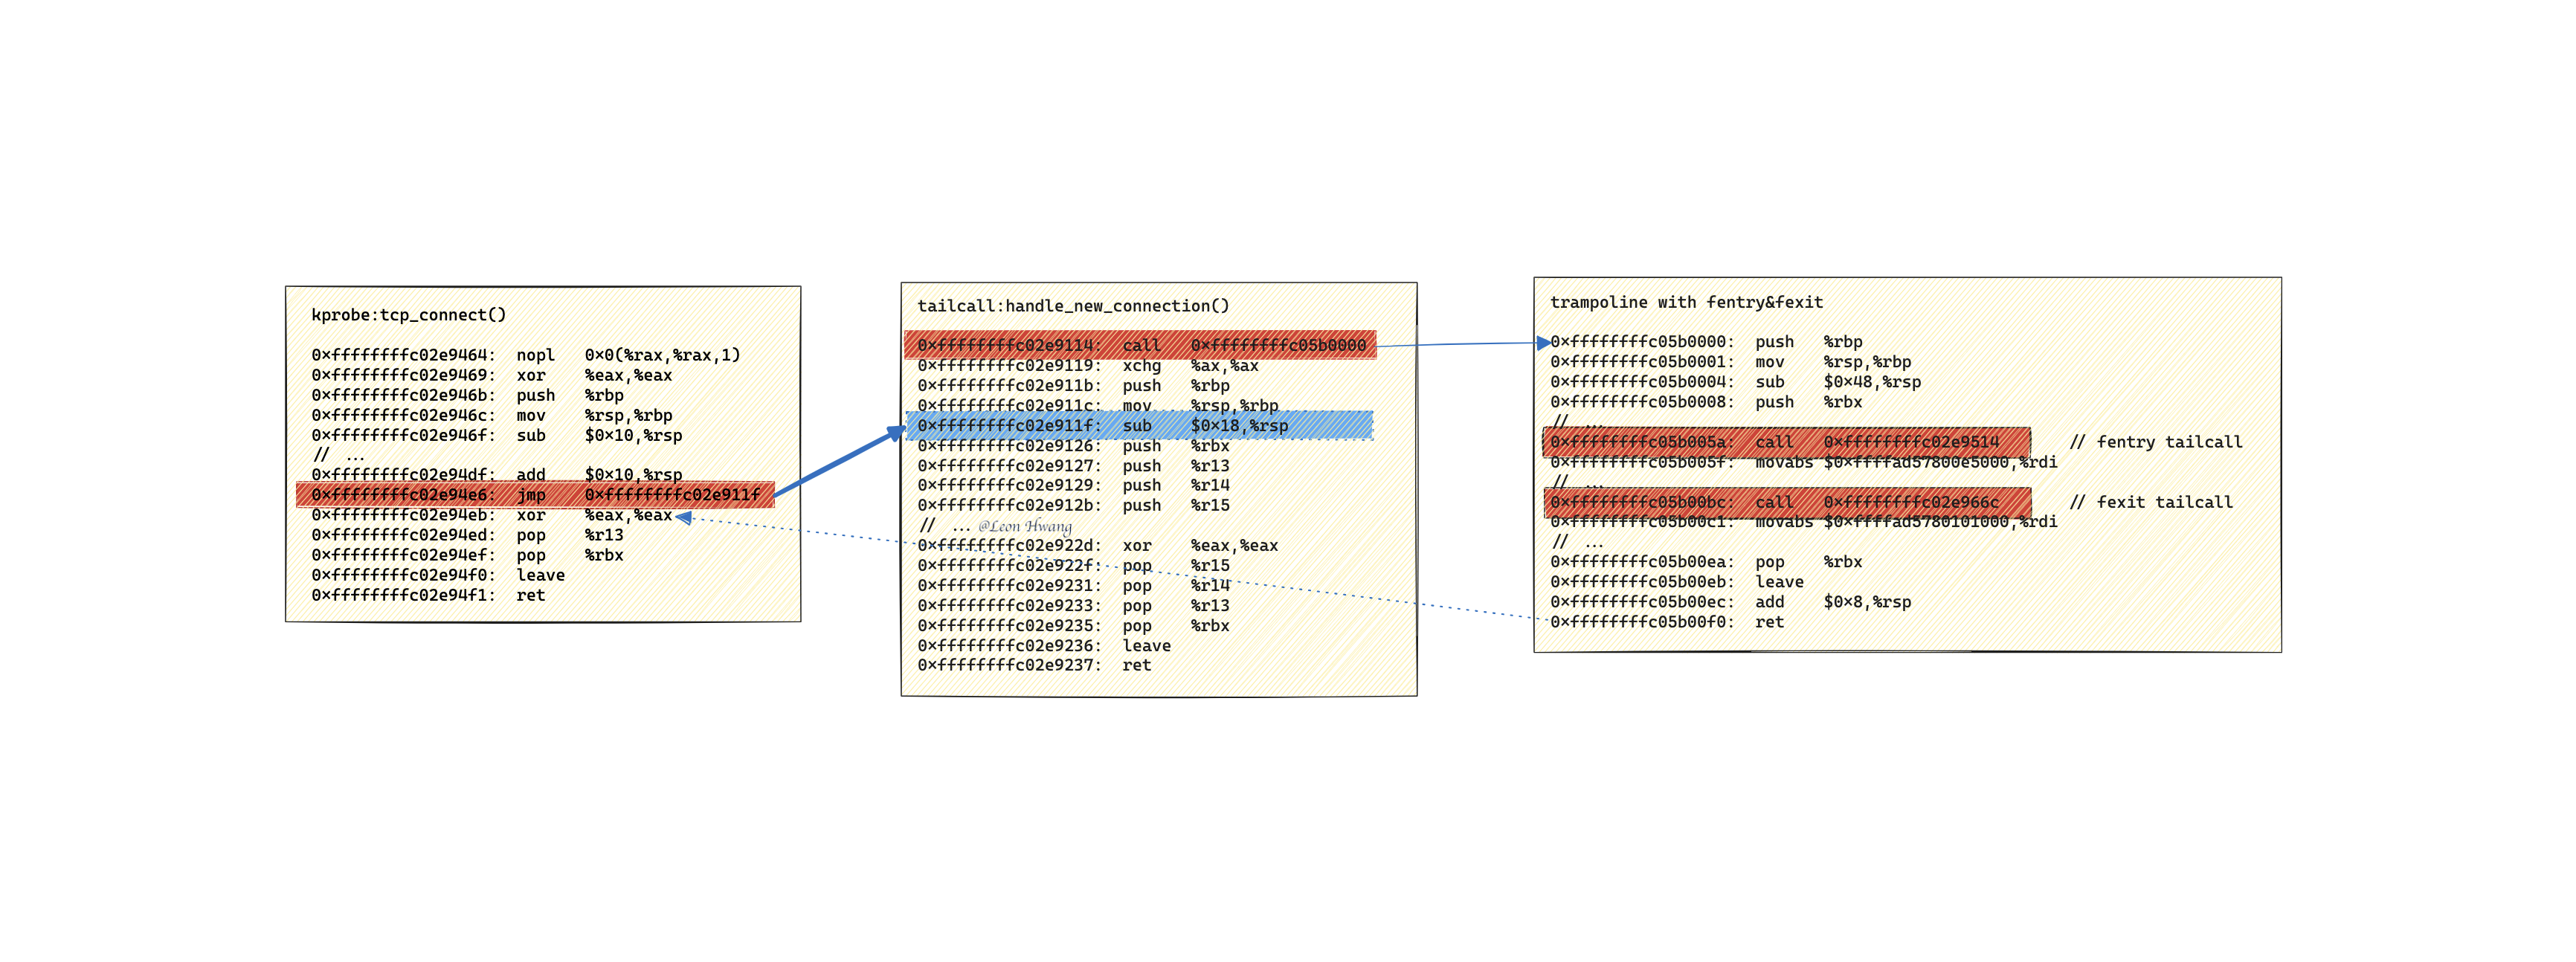
可以看到,进行 tailcall 后,tailcall 所使用的 jmp 指令跳转的目标地址是 0xffffffffc02e911f;该地址并不是 tailcall 程序的入口地址,而是偏移入口地址 5 条指令的地址。
最终导致,jmp 后直接跳过第一条指令,即跳过了 fentry/fexit 程序的执行;换句话说,tailcall 程序无法直接使用 fentry/fexit 进行 trace。
tailcall 复用当前栈空间
此时,该想起:tailcall 的目标之一是复用调用者的栈空间。
如果 jmp 指令没有跳过前面几条指令,而是跳到 0xffffffffc02e9114:
1
2
3
4
5
6
|
# gdb -q -c /proc/kcore -ex 'x/150i 0xffffffffc02e9114' -ex 'quit'
   0xffffffffc02e9114:  call   0xffffffffc05b0000
   0xffffffffc02e9119:  xchg   %ax,%ax
   0xffffffffc02e911b:  push   %rbp
   0xffffffffc02e911c:  mov    %rsp,%rbp
   0xffffffffc02e911f:  sub    $0x18,%rsp
|
就会通过 push $rbp 和 mov %rsp,%rbp 这两条指令使用一段新的栈空间,而不是复用调用者的栈空间。
这便违背了 tailcall 复用调用者栈空间的初衷。
JIT 里对 tailcall 的处理
既然事实已如此,就回过头来看看 JIT 里对 tailcall 的处理。
在 x86 JIT 里,对 bpf_tail_call_static() 的处理如下:
 1
 2
 3
 4
 5
 6
 7
 8
 9
10
11
12
13
14
15
16
17
18
19
20
21
22
23
24
25
26
27
28
29
30
31
32
33
34
35
36
37
38
39
40
41
42
43
44
|
// ${KERNEL}/arch/x86/net/bpf_jit_comp.c

static void emit_bpf_tail_call_direct(struct bpf_jit_poke_descriptor *poke,
                      u8 **pprog, u8 *ip,
                      bool *callee_regs_used, u32 stack_depth,
                      struct jit_context *ctx)
{
    int tcc_off = -4 - round_up(stack_depth, 8);
    u8 *prog = *pprog, *start = *pprog;
    int offset;

    /*
     * if (tail_call_cnt++ >= MAX_TAIL_CALL_CNT)
     *  goto out;
     */
    EMIT2_off32(0x8B, 0x85, tcc_off);             /* mov eax, dword ptr [rbp - tcc_off] */
    EMIT3(0x83, 0xF8, MAX_TAIL_CALL_CNT);         /* cmp eax, MAX_TAIL_CALL_CNT */

    offset = ctx->tail_call_direct_label - (prog + 2 - start);
    EMIT2(X86_JAE, offset);                       /* jae out */
    EMIT3(0x83, 0xC0, 0x01);                      /* add eax, 1 */
    EMIT2_off32(0x89, 0x85, tcc_off);             /* mov dword ptr [rbp - tcc_off], eax */

    poke->tailcall_bypass = ip + (prog - start);
    poke->adj_off = X86_TAIL_CALL_OFFSET;           /* 关键之处 */
    poke->tailcall_target = ip + ctx->tail_call_direct_label - X86_PATCH_SIZE;
    poke->bypass_addr = (u8 *)poke->tailcall_target + X86_PATCH_SIZE;

    emit_jump(&prog, (u8 *)poke->tailcall_target + X86_PATCH_SIZE,
          poke->tailcall_bypass);

    pop_callee_regs(&prog, callee_regs_used);
    EMIT1(0x58);                                  /* pop rax */
    if (stack_depth)
        EMIT3_off32(0x48, 0x81, 0xC4, round_up(stack_depth, 8));

    memcpy(prog, x86_nops[5], X86_PATCH_SIZE);
    prog += X86_PATCH_SIZE;

    /* out: */
    ctx->tail_call_direct_label = prog - start;

    *pprog = prog;
}
|
其中关键之处是:poke->adj_off = X86_TAIL_CALL_OFFSET;。
这是在 tailcall 调用者侧对 bpf_tail_call_static() 的处理。
而后,在给 bpf prog ARRAY bpf map 更新 bpf prog 时,会更新某条指令:
 1
 2
 3
 4
 5
 6
 7
 8
 9
10
11
12
13
14
15
16
17
18
19
20
21
22
23
24
25
26
27
28
29
30
31
32
33
34
35
36
37
38
|
// ${KERNEL}/arch/x86/net/bpf_jit_comp.c

static void bpf_tail_call_direct_fixup(struct bpf_prog *prog)
{
    struct bpf_jit_poke_descriptor *poke;
    struct bpf_array *array;
    struct bpf_prog *target;
    int i, ret;

    for (i = 0; i < prog->aux->size_poke_tab; i++) {
        poke = &prog->aux->poke_tab[i];
        if (poke->aux && poke->aux != prog->aux)
            continue;

        WARN_ON_ONCE(READ_ONCE(poke->tailcall_target_stable));

        if (poke->reason != BPF_POKE_REASON_TAIL_CALL)
            continue;

        array = container_of(poke->tail_call.map, struct bpf_array, map);
        mutex_lock(&array->aux->poke_mutex);
        target = array->ptrs[poke->tail_call.key];
        if (target) {
            ret = __bpf_arch_text_poke(poke->tailcall_target,   /* 关键之处 */
                           BPF_MOD_JUMP, NULL,
                           (u8 *)target->bpf_func +
                           poke->adj_off);
            BUG_ON(ret < 0);
            ret = __bpf_arch_text_poke(poke->tailcall_bypass,   /* 附带之处 */
                           BPF_MOD_JUMP,
                           (u8 *)poke->tailcall_target +
                           X86_PATCH_SIZE, NULL);
            BUG_ON(ret < 0);
        }
        WRITE_ONCE(poke->tailcall_target_stable, true);
        mutex_unlock(&array->aux->poke_mutex);
    }
}
|
其中需要关注的地方:
__bpf_arch_text_poke(poke->tailcall_target, BPF_MOD_JUMP, NULL, (u8 *)target->bpf_func + poke->adj_off);__bpf_arch_text_poke(poke->tailcall_bypass, BPF_MOD_JUMP, (u8 *)poke->tailcall_target + X86_PATCH_SIZE, NULL); 将原先 jmp 指令替换成 nop 指令,为了不跳过后面的 tailcall 逻辑。
其中 poke->adj_off = X86_TAIL_CALL_OFFSET;,而 X86_TAIL_CALL_OFFSET 的值是 11。用上面的例子来计算:0xffffffffc02e911f - 0xffffffffc02e9114 = 11。
小结
tailcall 程序无法直接使用 fentry/fexit 进行 trace。tailcall 为了复用调用者的栈空间,会跳过前面几条指令,而这几条指令包含了 call fentry/fexit 程序的指令。
简而言之,tailcall 程序不支持 fentry/fexit 进行 trace。
所以,对于 tailcall 地狱,就无法使用 fentry/fexit 进行 trace,从而无法通过外部手段跟踪 tailcall 地狱中的调用链。